
FTIR Spectrometer
Thermo Scientific Nicolet iS5

FTIR (Fourier-transform infrared) spectroscopy measures infrared absorption to help compare and identify plastics, fibers, adhesives, and residues. Most lab measurements use the ATR accessory.
Before You Start
- Samples must be non-hazardous and safe to handle in the Breakerspace.
- Many solids, semi-solids, powders, pastes, and liquids can be measured by ATR.
- Cleaning solvents must also be non-hazardous. Isopropyl alcohol is the routine cleaning solvent for the ATR crystal.
- Samples should be dry enough, stable enough, and contained enough that they will not spill, crumble into the instrument, stain the crystal plate, or leave persistent odor.
- Volatile liquids may evaporate during collection and should be discussed with staff if containment or exposure is uncertain.
- Powders should be used sparingly and cleaned completely after collection.
- Sharp, sticky, abrasive, hard, reactive, odorous, unknown, staining, or difficult-to-clean samples should be discussed with staff before measurement.
If you have any questions about whether a material is appropriate to characterize in the Breakerspace, please ask before bringing it to the lab.
Standard Operating Protocol
Independent use requires FTIR training. Trained users can open or print the two-page Quick Guide.
Instrument Startup
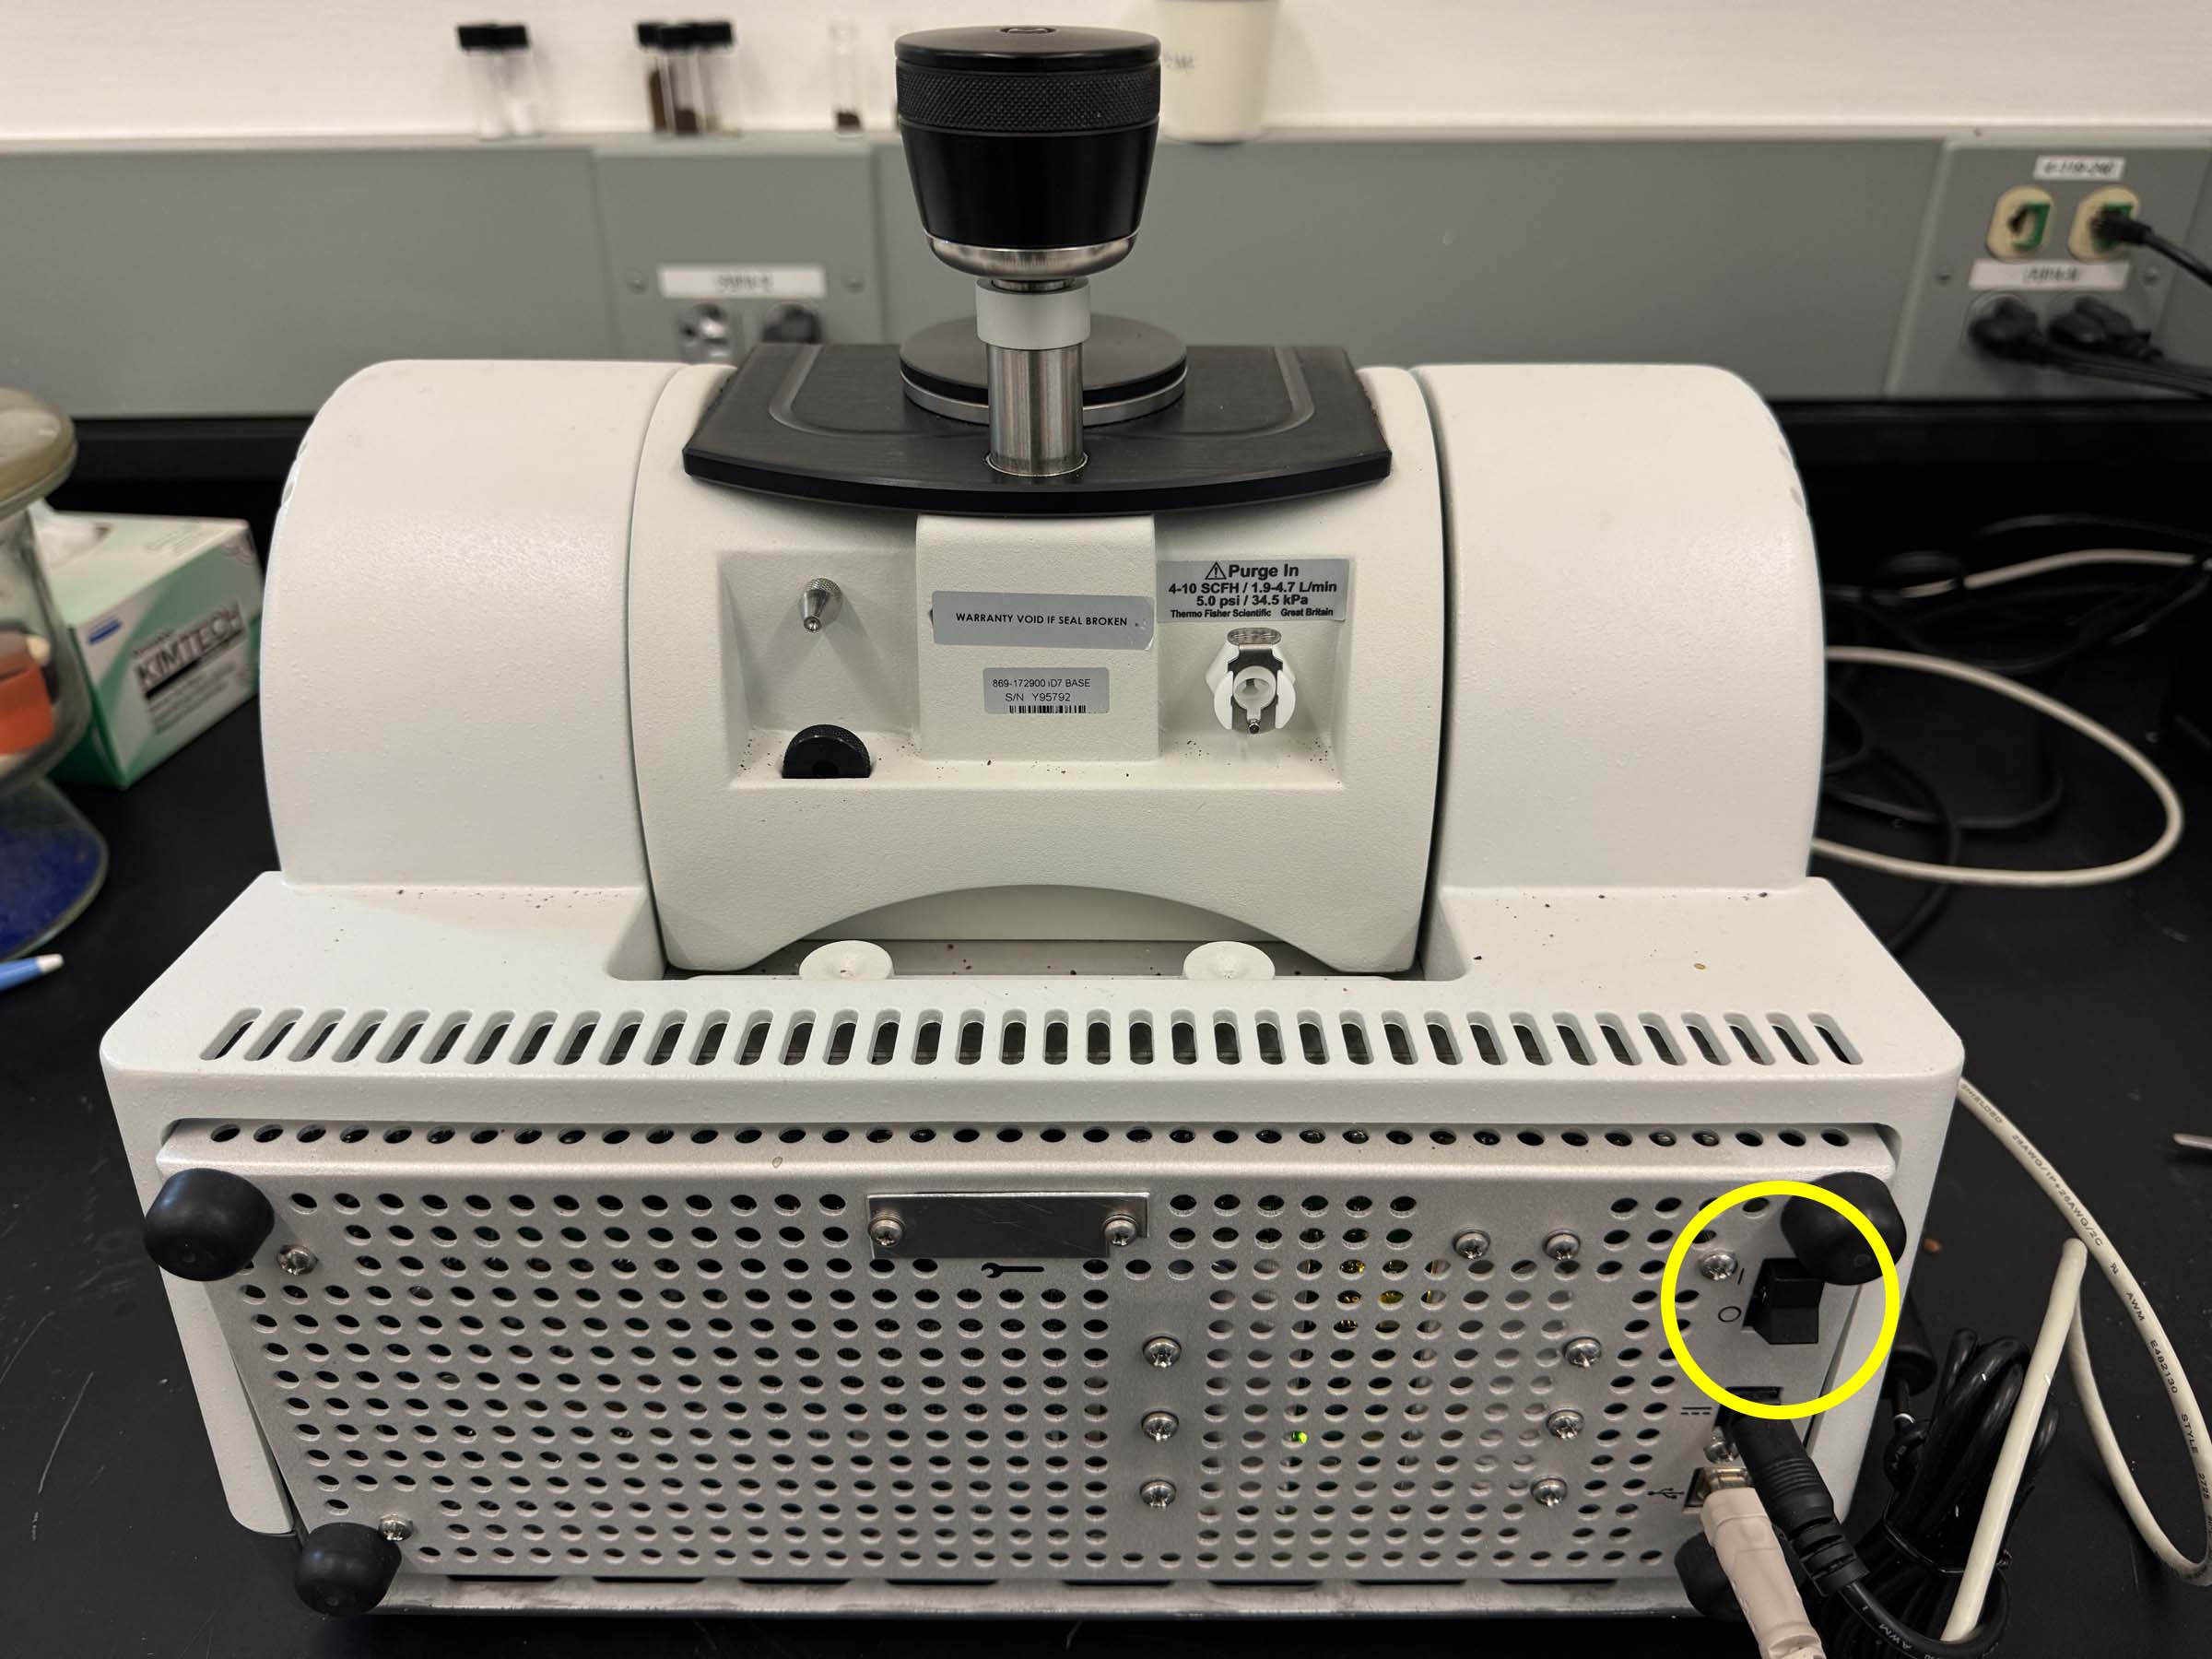
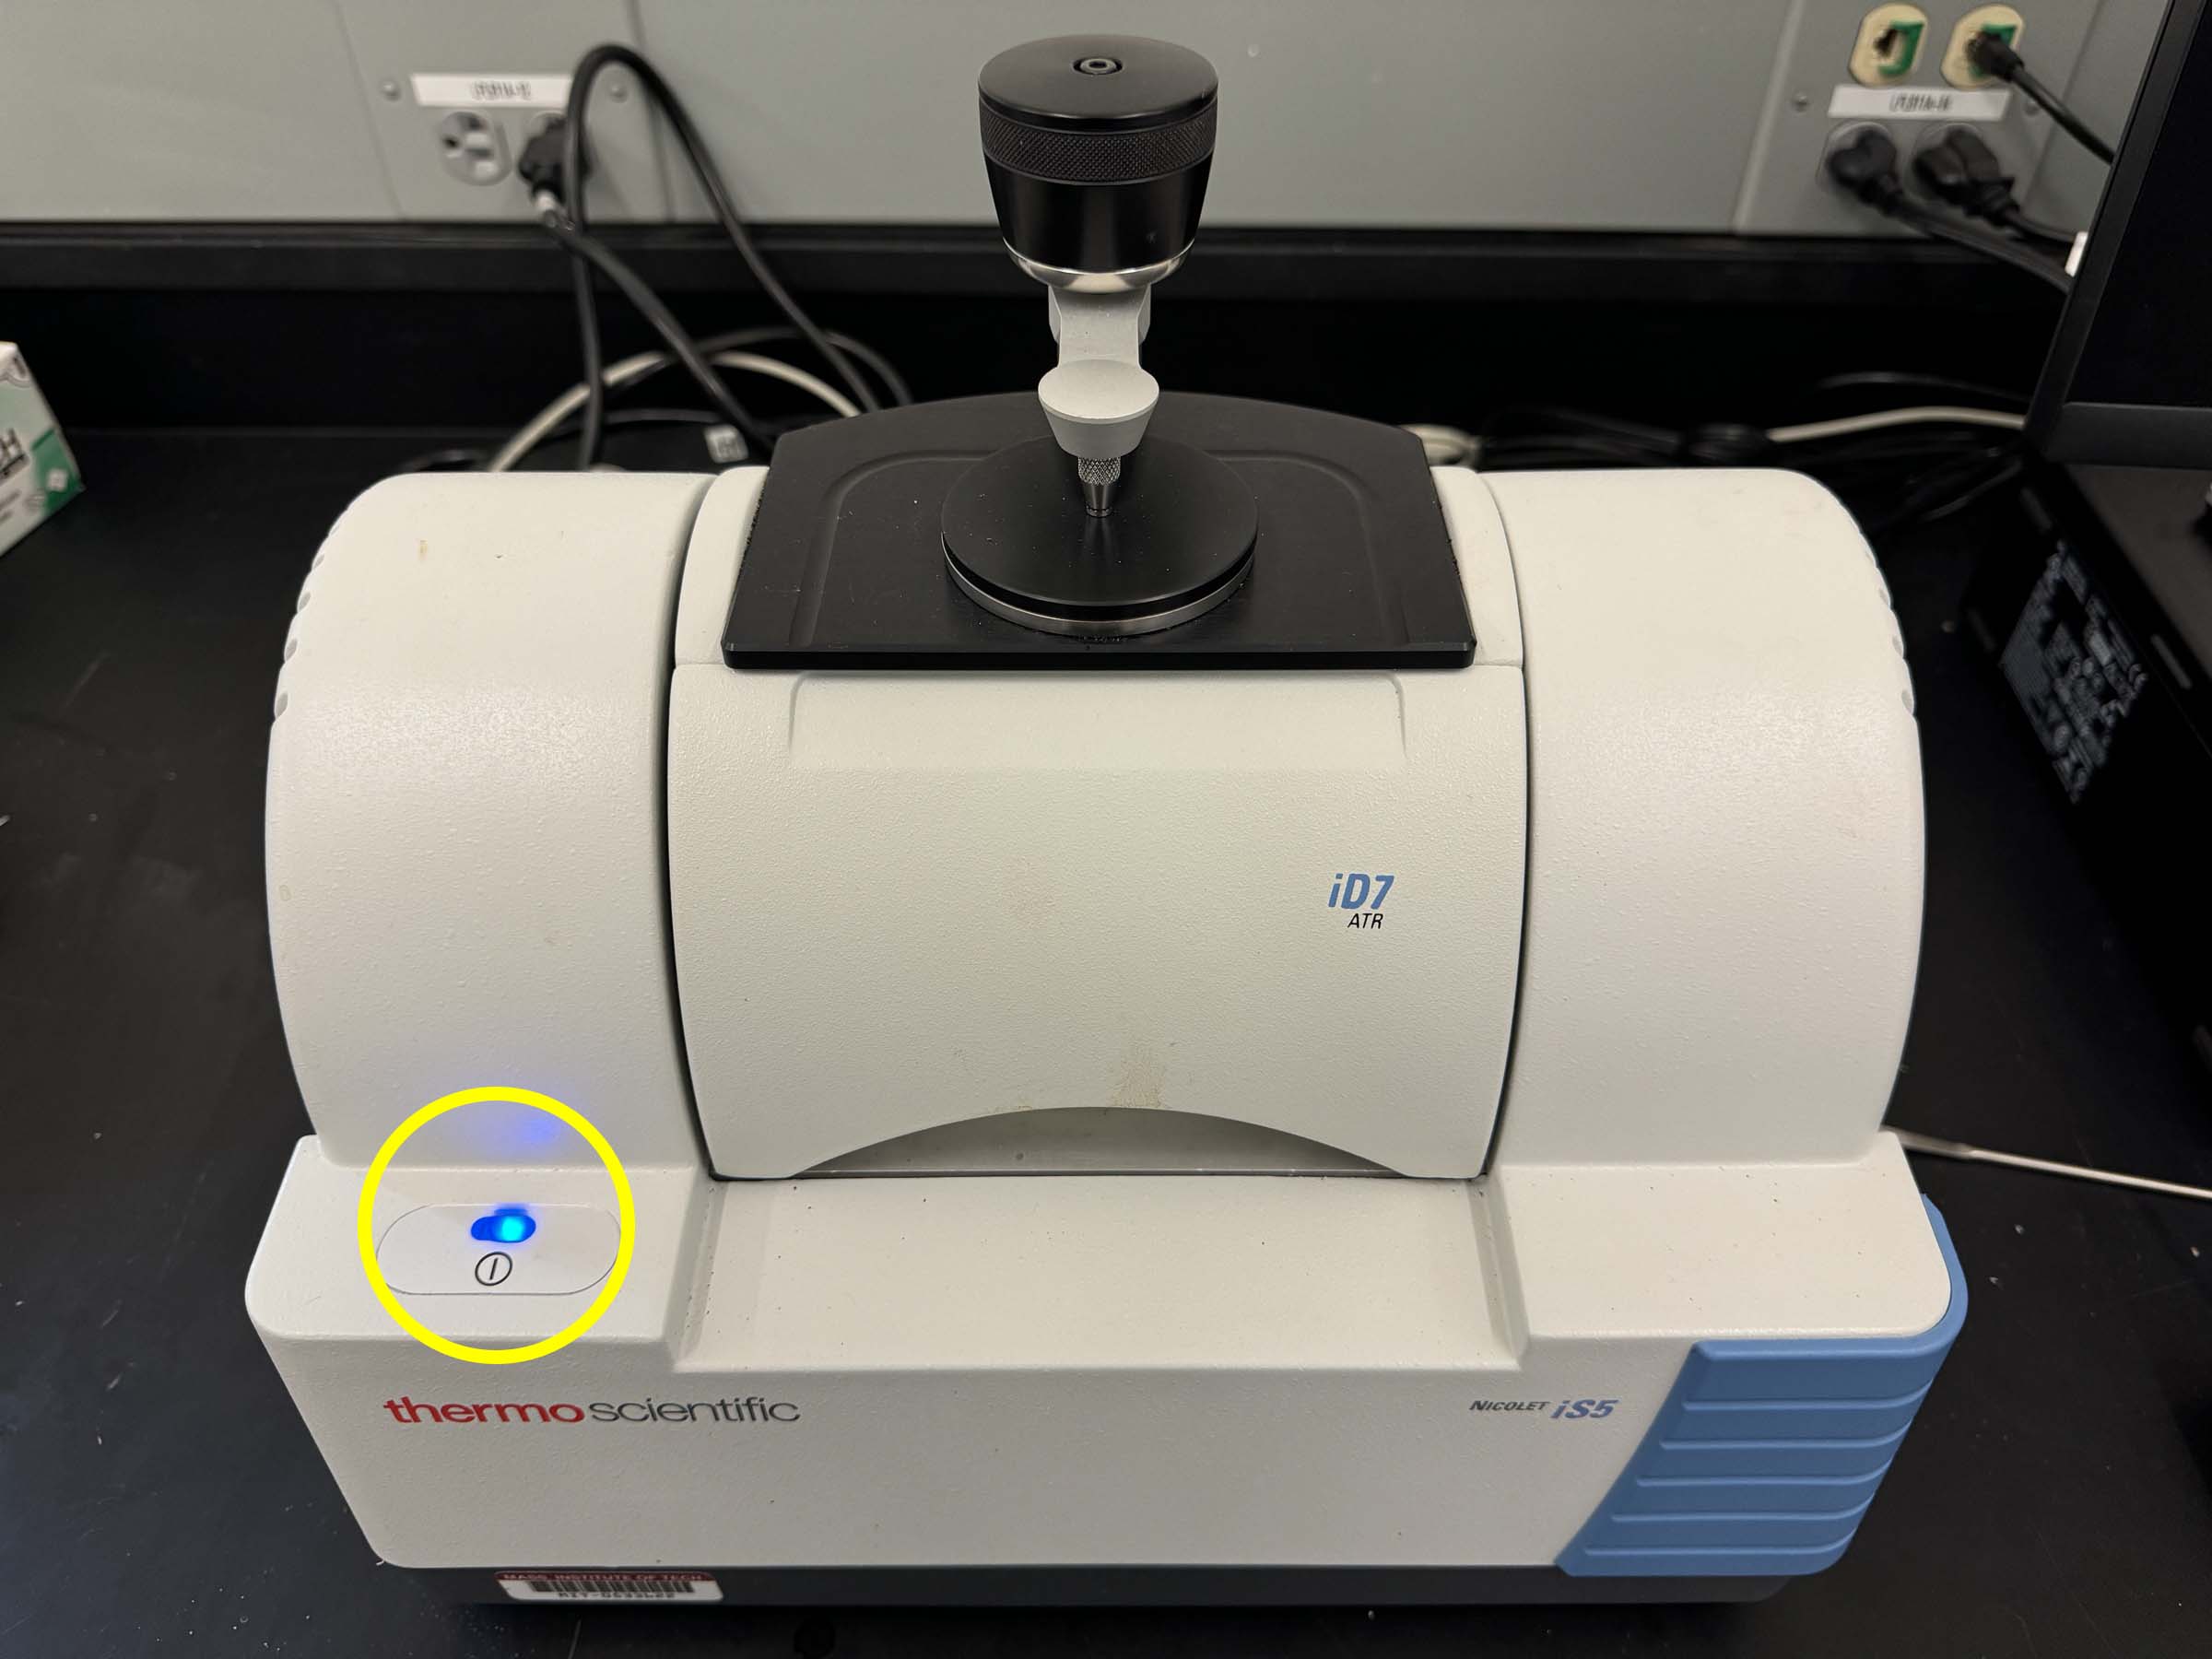
- Power on the instrument, if needed.
- Log on to the instrument workstation using your MIT Kerberos.
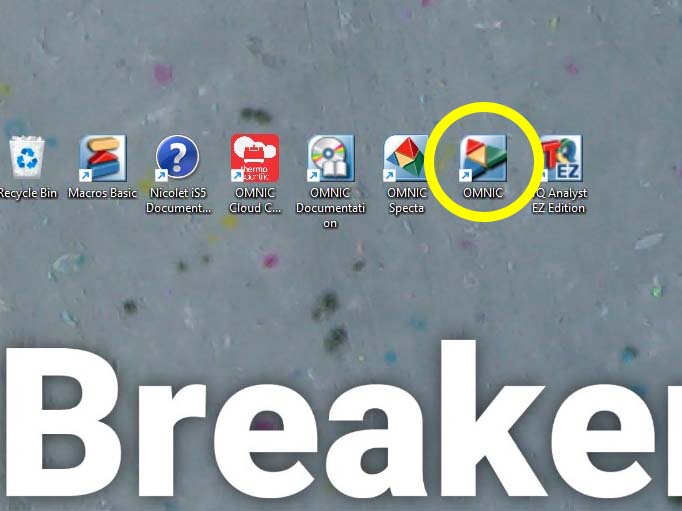
- Start OMNIC software.
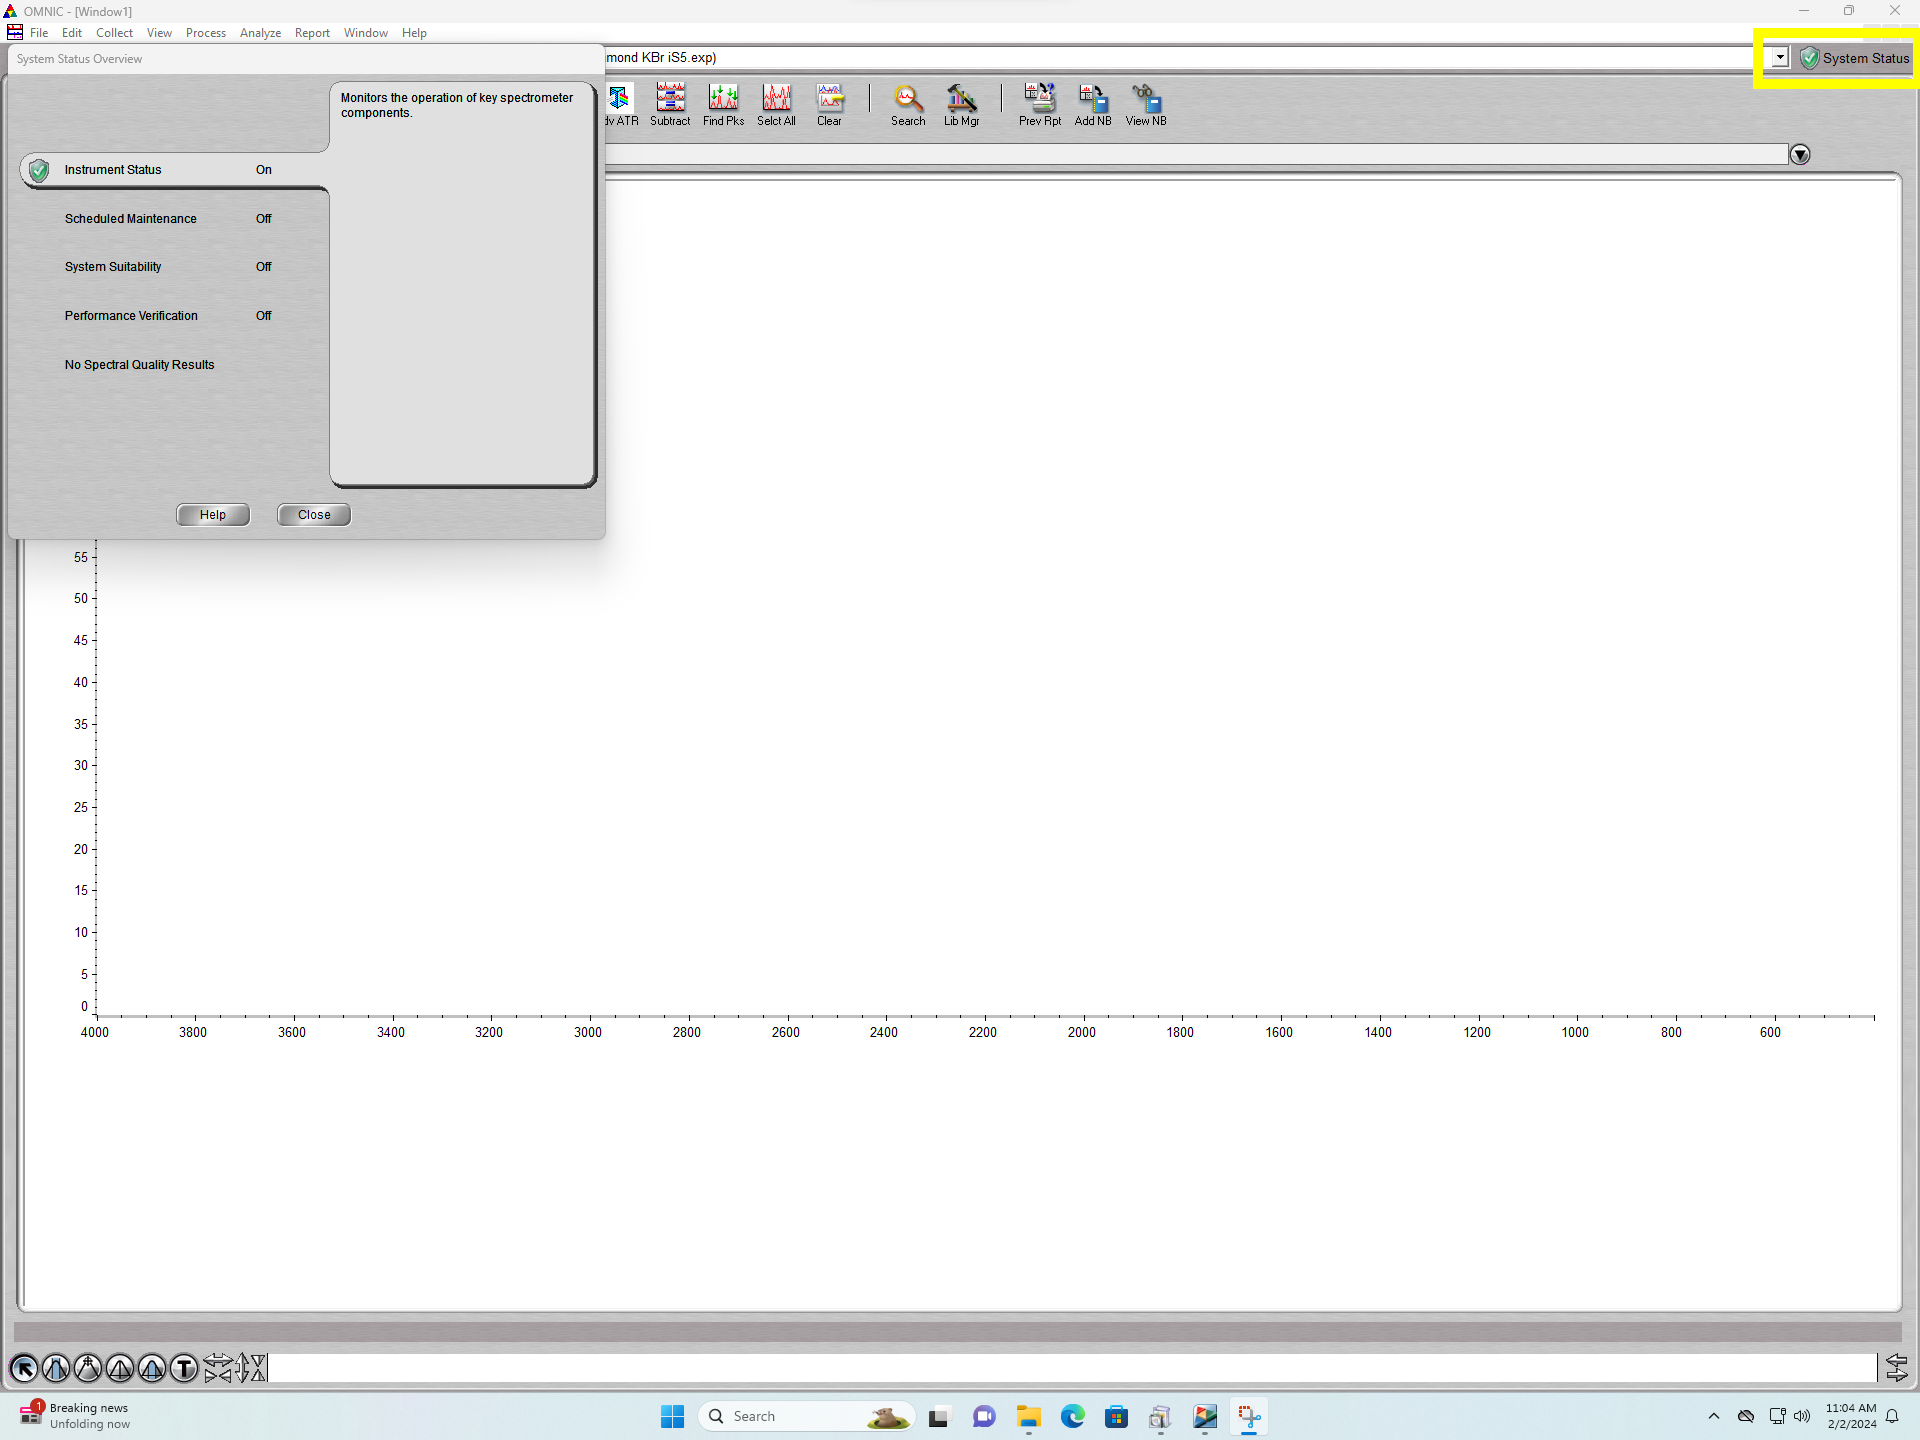
- Verify System Status shows a green check. If it does not, stop and ask staff.
- Remove the protective cover from the ATR crystal plate.
- Clean and dry the ATR crystal.
- Collect a background before loading samples.
Operation
- Wear nitrile gloves when handling samples, ATR accessories, the pressure tower, pressure tips, Kimwipes, or cleaning solvent.
- Remove gloves before using the keyboard, mouse, or instrument workstation.
- Clean the ATR crystal before each sample or whenever contamination is possible.
- Choose the sampling method and pressure tip appropriate for the sample.
- Load the sample so it makes good contact with the ATR crystal or the selected accessory.
- Collect the sample spectrum.
- Save each spectrum you need. Spectra must be selected and saved individually.
- Wear gloves again before unloading the sample or cleaning the crystal.
- Repeat background, sample collection, cleaning, and saving as needed.
- If negative or unexpected features suggest a contaminated background, wear gloves to unload the sample, clean and dry the crystal and plate, then remove gloves and collect a complete new background with the crystal bare and unclamped. Reload and recollect the sample; stop and ask staff if the features remain.
Instrument Shutdown
- Save all data you need and copy it to your own storage; the workstation is not a backup.
- Close OMNIC.
- Log off the workstation.
- Clean and dry the ATR crystal.
- Put the cover on the crystal plate and clamp it in place using the pressure tower.
- Leave the instrument powered on. The manufacturer recommends leaving the instrument powered when not in use.
- Leave the work area clean and remove all samples, wipes, and waste.
Step-by-Step Help
Clean The ATR Crystal
- Apply a few drops of isopropyl alcohol to a Kimwipe.
- Wipe with the wetted portion of the Kimwipe, starting in the center and working outward.
- Use a dry portion of the Kimwipe, or a new Kimwipe, to dry the crystal and surrounding area.
- Confirm that no residue, powder, fibers, or droplets remain before collecting a background or leaving the instrument.
Set Up Collection
Experiment setup allows you to change collection parameters to fit the measurement. For faster collections, reduce the number of scans or scan resolution and note how the estimated time changes. To improve the signal-to-noise ratio, increase the number of scans.
There are two ways to collect a spectrum, with preview on or off. The routine Level 1 training workflow uses Preview data collection enabled; the trainer confirms that expected state before collection. When preview is enabled, the instrument shows a live spectrum that refreshes during preview mode. Once the sample setup is ready, run the full scan by clicking Start Collection in the upper right. Outside the training workflow, deselect Preview data collection only if you intentionally want to bypass preview and run the full scan immediately. This setting applies to both background and sample collection.
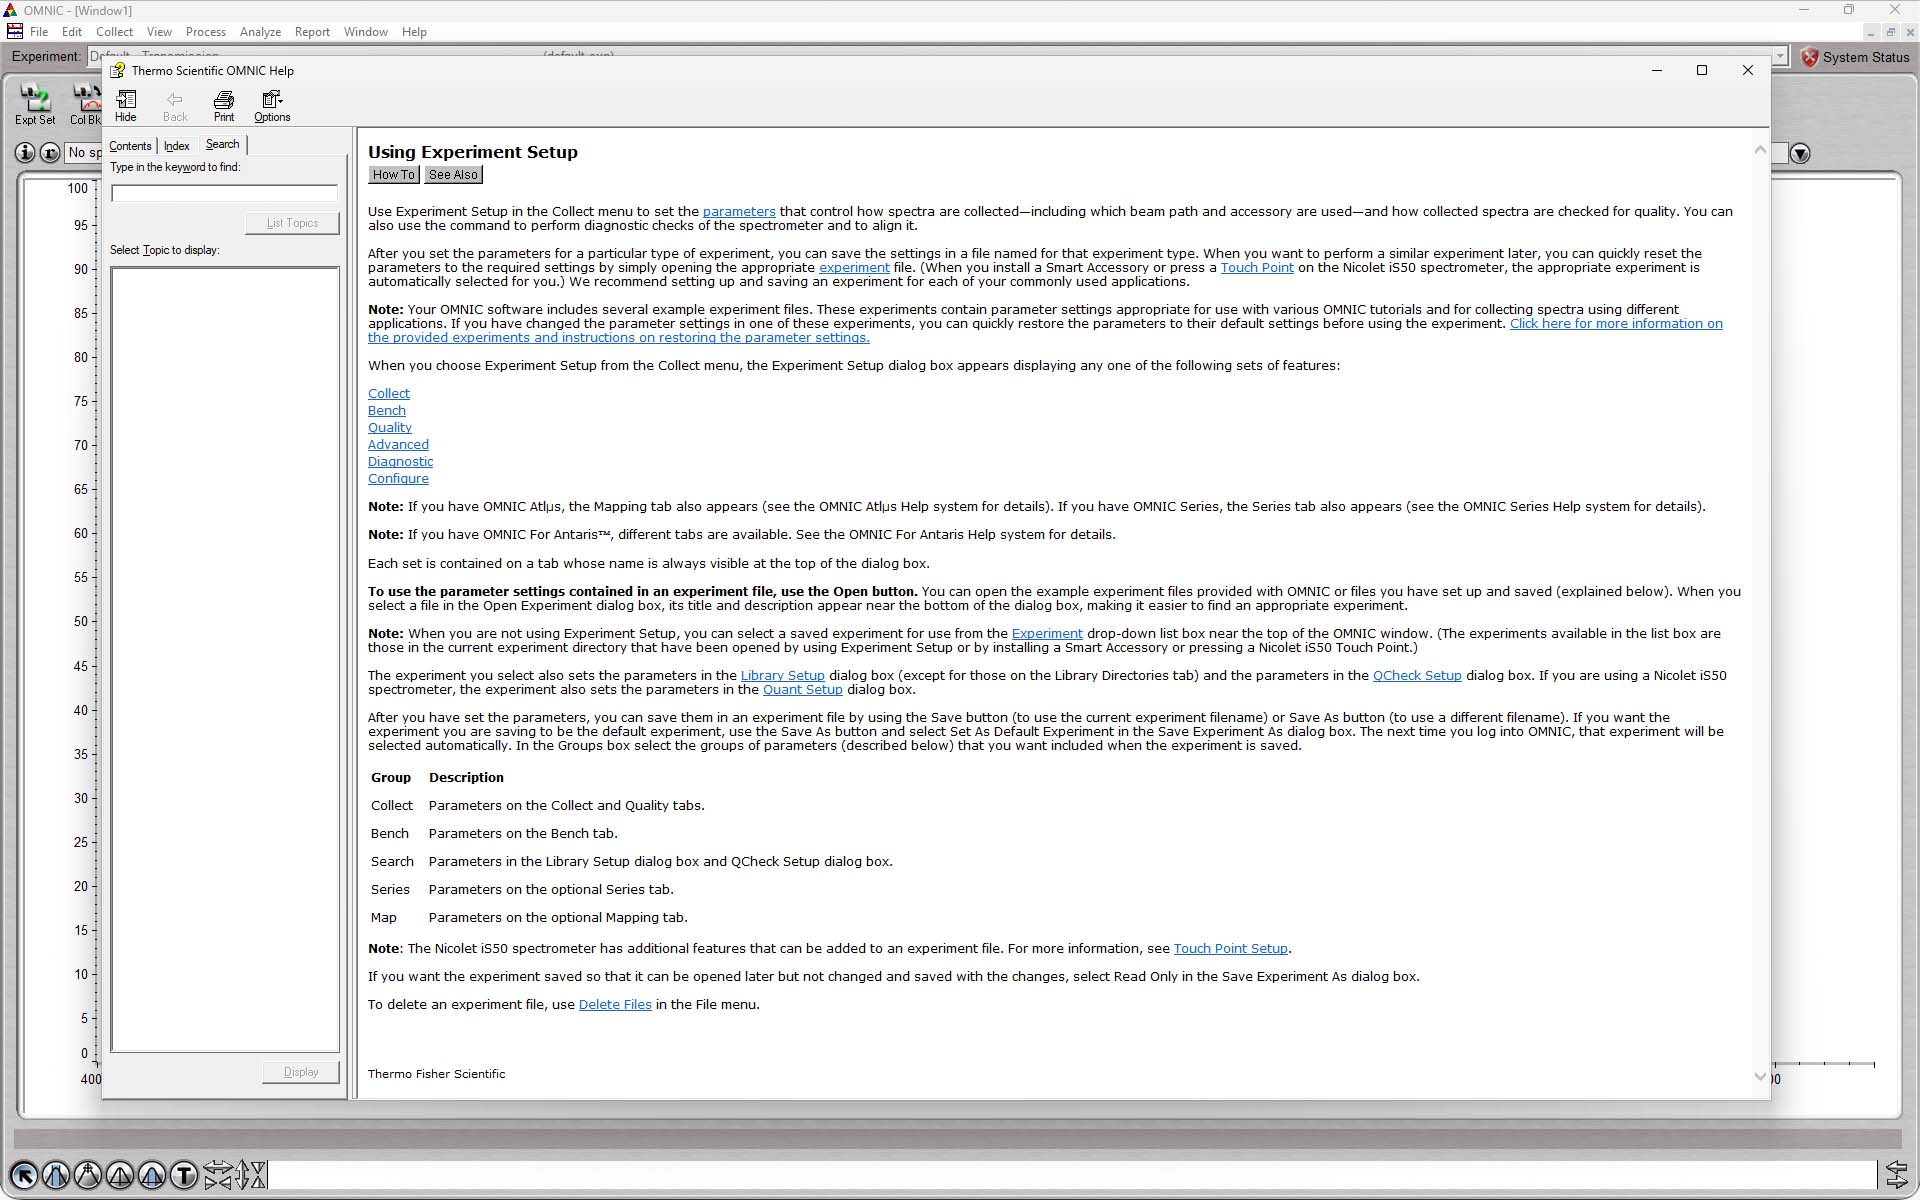
For a comprehensive explanation of the experiment setup parameters, select help in the lower left.

Preview Data Collection Enabled
Preview Data Collection Not Enabled
Collect A Background
Before collecting spectra, collect a background spectrum.
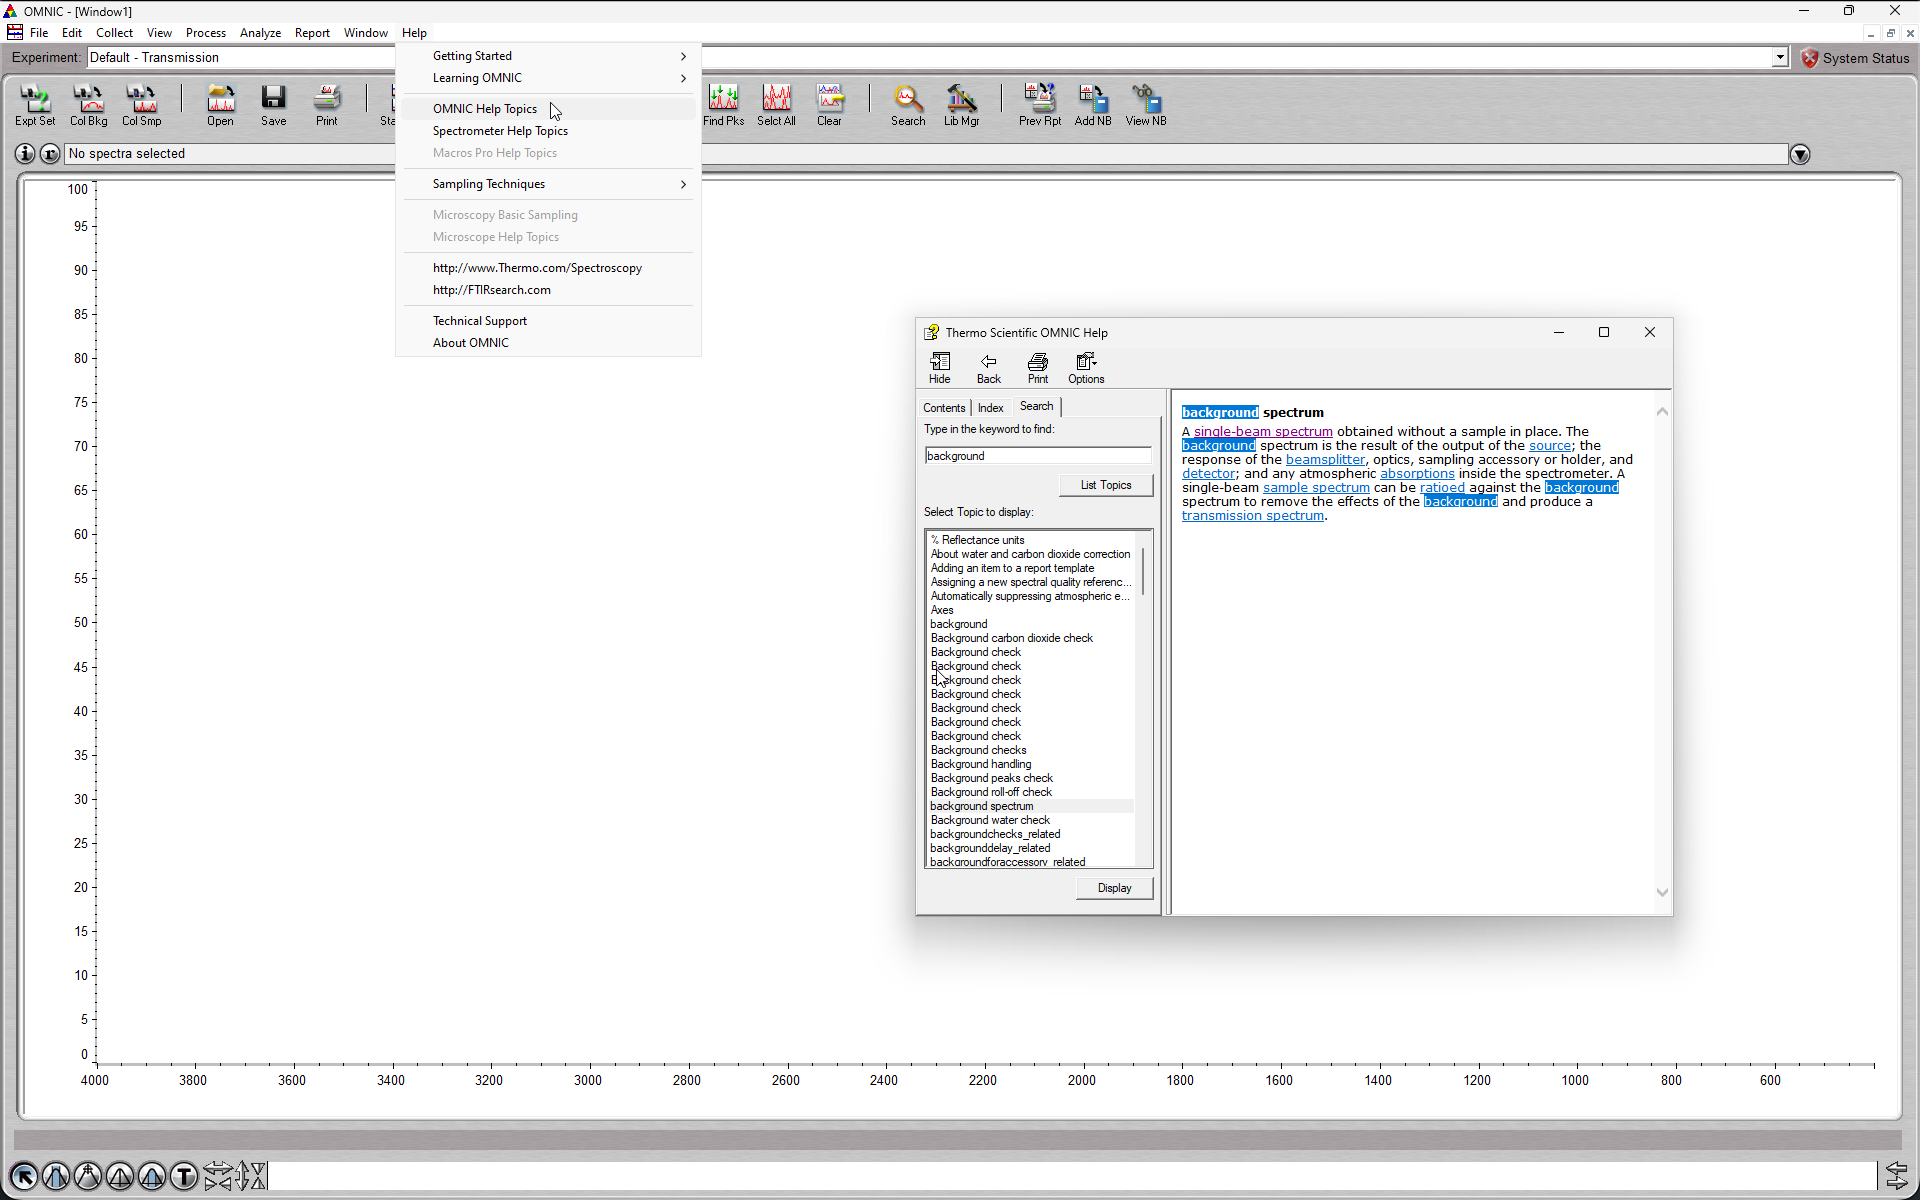
A background spectrum is a single-beam spectrum obtained without a sample in place. The background spectrum is the result of the output of the source; the response of the beamsplitter, optics, sampling accessory or holder, and detector; and any atmospheric absorptions inside the spectrometer. A single-beam sample spectrum can be ratioed against the background spectrum to remove the effects of the background and produce a transmission spectrum. (Definition from the Thermo Scientific OMNIC Help Topics)
- iD7 ATR accessory background collection is run with the clean, dry diamond crystal exposed to air and no pressure clamp.
- iD1 transmission accessory background collection is run with no sample in the compartment.
- EasiDiff diffuse reflectance background collection is run on a sample cup holding pure KBr powder.
- Set up the instrument for your experiment and click Collect Background.
- When preview is enabled, do not use the shape of the live background preview as a pass/fail test. Confirm the physical setup instead: the crystal is clean, dry, bare, and unclamped. Then click Start Collection to run the complete background scan.
- After the background is collected, you can choose to add it to the spectra window or not. In both cases, that background scan will automatically be used for subsequent sample collections.
Negative absorbance in an ATR spectrum can indicate the crystal was not clean during background collection.
Load Your Sample
To maximize signal strength, the sample must make good contact with the ATR window. Collect a background before loading samples.
Solid Samples
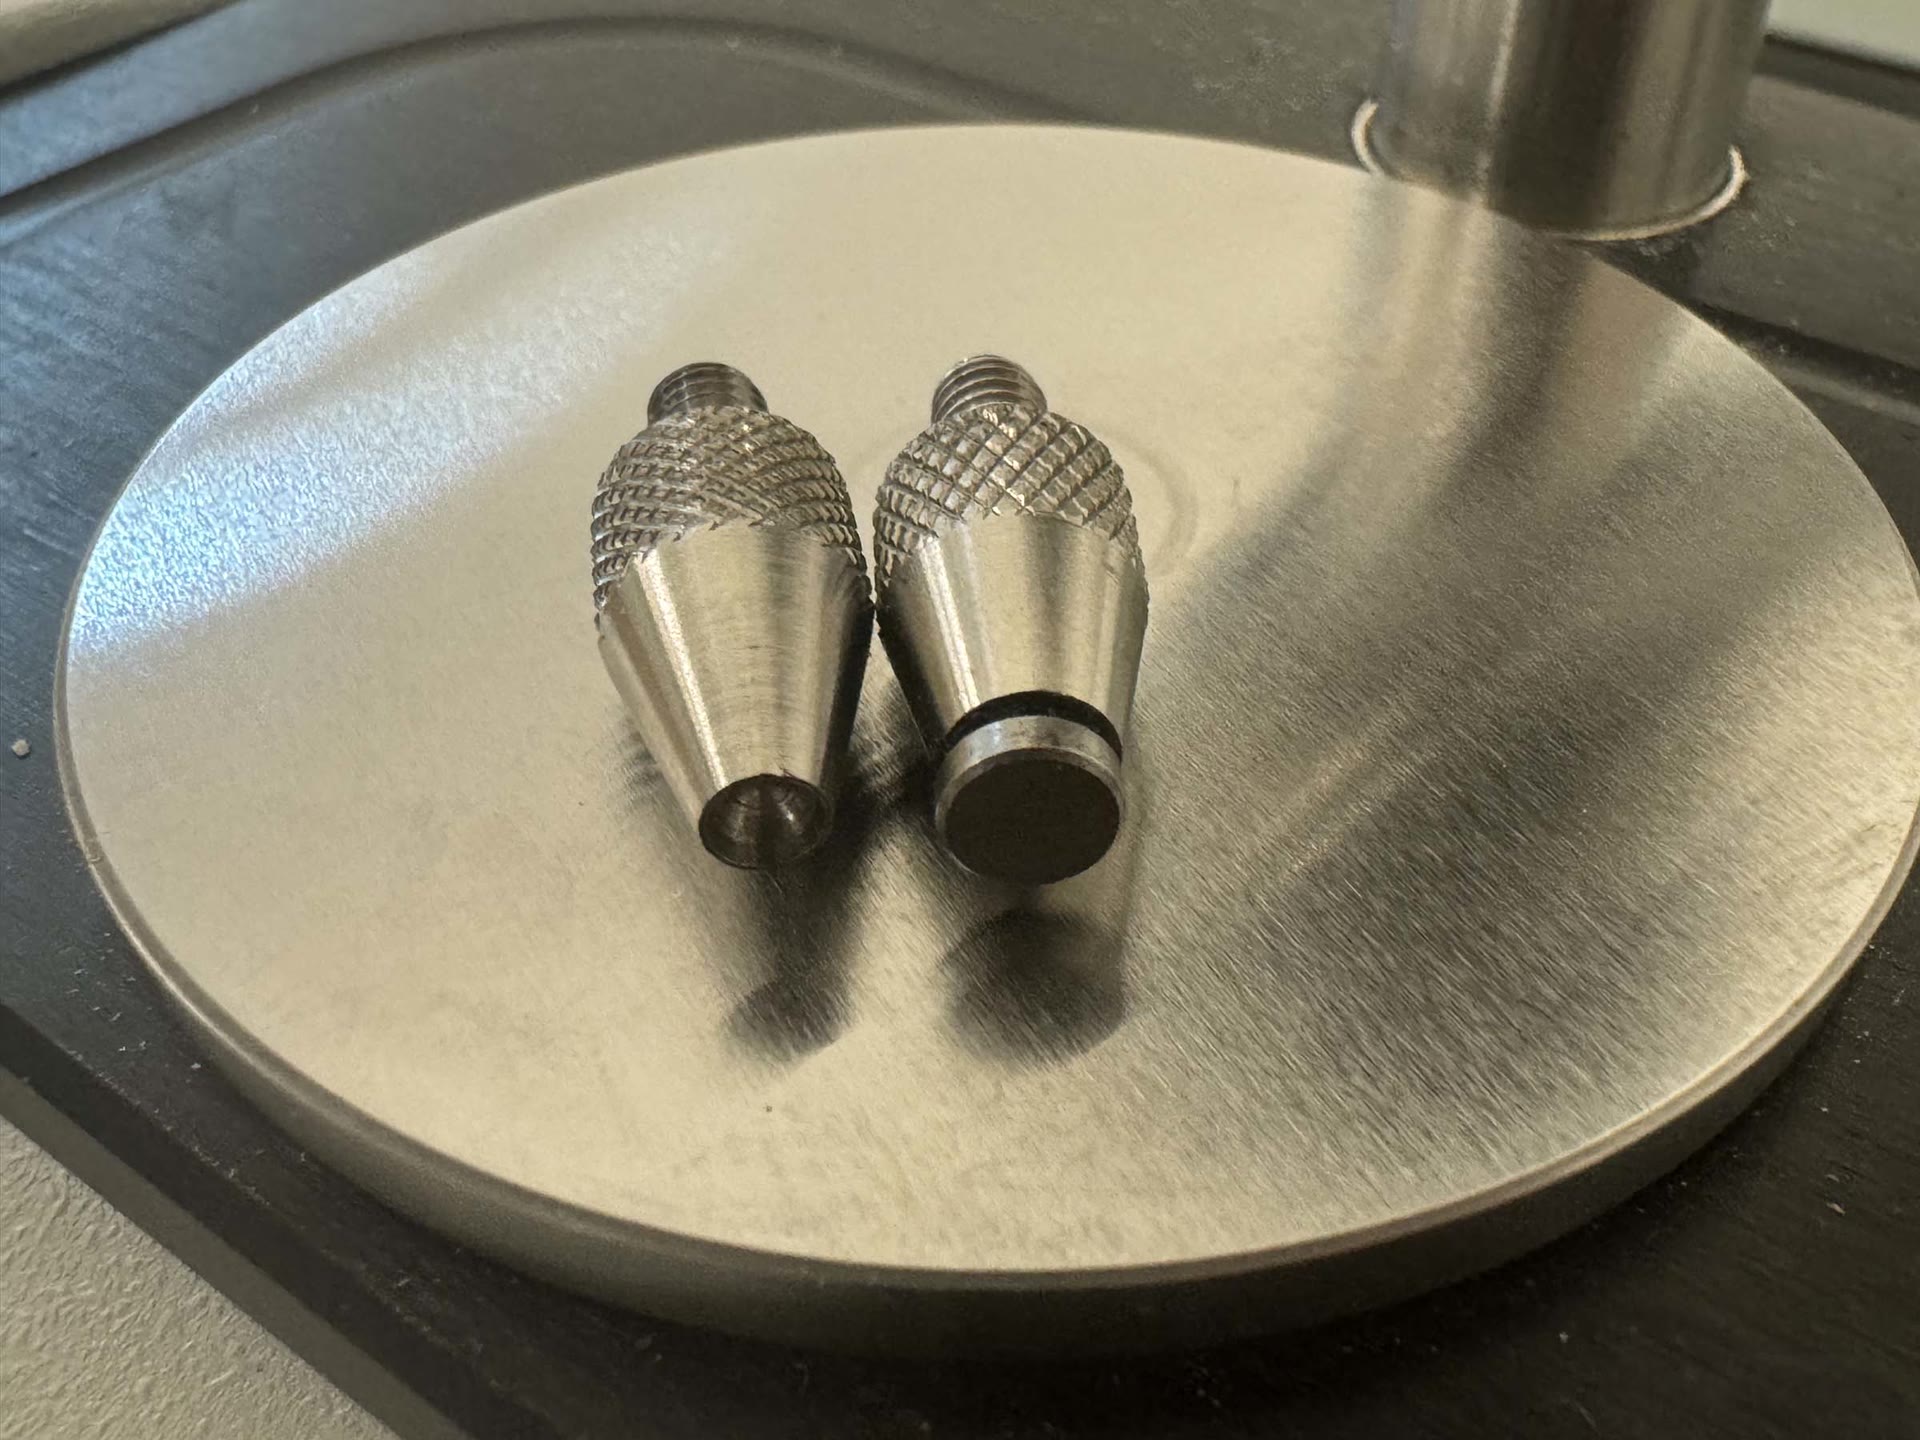
- Select the self-leveling pressure tip.
- Use a solid sample with a smooth, clean face where possible.
- Cover the ATR crystal with the sample.
- Position the pressure tower over the window.
- Tighten the knob until the clutch slips to provide clamping pressure.
Although many solid samples will not contaminate the window, wipe the window with isopropyl alcohol and a Kimwipe between samples.
Powder Samples
It is especially important that powders contact the surface of the diamond window as completely as possible, so finely ground powders often work better. Preview mode can help verify that the pressure tip is pushing the powder into intimate contact with the ATR crystal before collecting a spectrum.
- Either the concave or self-leveling pressure tip can work. Try both if one does not give good contact.
- Use a spatula to place a small amount of powder sufficient to cover the ATR crystal.
- Position the pressure tower over the ATR crystal.
- Tighten the knob until the clutch slips.
- Clean the crystal and surrounding plate completely after measurement.
Liquid Samples
- Place a small droplet of sample on the ATR crystal.
- Non-volatile liquids can be run uncovered without the pressure tower.
- Volatile samples can be covered with the volatiles cover to reduce evaporation. Clamp the volatiles cover with the pressure tower.
- Clean the crystal and surrounding plate completely after measurement.
Collect A Spectrum
Once the background is collected, load the sample according to the instructions above and click Collect Sample. Follow the process based on your experiment setup.
If preview is enabled, use the live spectrum as a practical contact check. A change from a near-zero trace to a sample spectrum shows that the ATR is detecting the sample, but it is not a universal spectrum-shape or signal-strength pass criterion. Spectra vary by material. If the signal is weak, improve contact between the sample and ATR crystal, adjust the pressure tip, or ask staff whether the sample is appropriate for ATR. When the sample setup is ready, click Start Collection to run the full scan.
If negative or unexpected features suggest that the background was contaminated, wear gloves to release the pressure tower and unload the sample. Clean and dry the crystal and plate, remove gloves, then collect a complete new background with the crystal bare and unclamped. Reload the sample and collect it again. If the features remain, stop and ask staff.
After the full scan completes, give the spectrum a descriptive name when OMNIC prompts.
Save Your Spectra
- Select and save each spectrum individually before closing OMNIC.
- Keep the raw spectra before exporting images, reports, or processed versions.
- Copy the data you need to your own storage; the workstation is not a backup.
Choose A Sampling Method
The iD7 ATR accessory stays on the instrument for routine work. The iD1 transmission and EasiDiff diffuse reflectance accessories support less common workflows.
| Goal | Typical method | Starting thought |
|---|---|---|
| Identify or compare a plastic, coating, adhesive, film, fiber, residue, paste, or solid organic material | iD7 ATR | Clean the crystal, collect a background, press the sample firmly against the ATR window, and compare spectra. |
| Measure a powder | iD7 ATR | Use a small amount of finely ground powder and choose the pressure tip that gives the best crystal contact. |
| Measure a non-volatile liquid | iD7 ATR | Place a small droplet on the crystal; clean thoroughly afterward. |
| Measure a volatile liquid | iD7 ATR with volatiles cover | Ask staff if volatility, odor, or exposure is uncertain. |
| Measure a thin film or prepared transmission sample | iD1 transmission accessory | Less common in routine training; confirm the accessory and sample geometry with staff. |
| Measure diffuse reflectance from a powder or rough solid | EasiDiff diffuse reflectance accessory | Specialist workflow; use a staff-approved method and background. |
Use The Volatiles Cover
Change Pressure Tips
Understand Your Results
Read A Spectrum
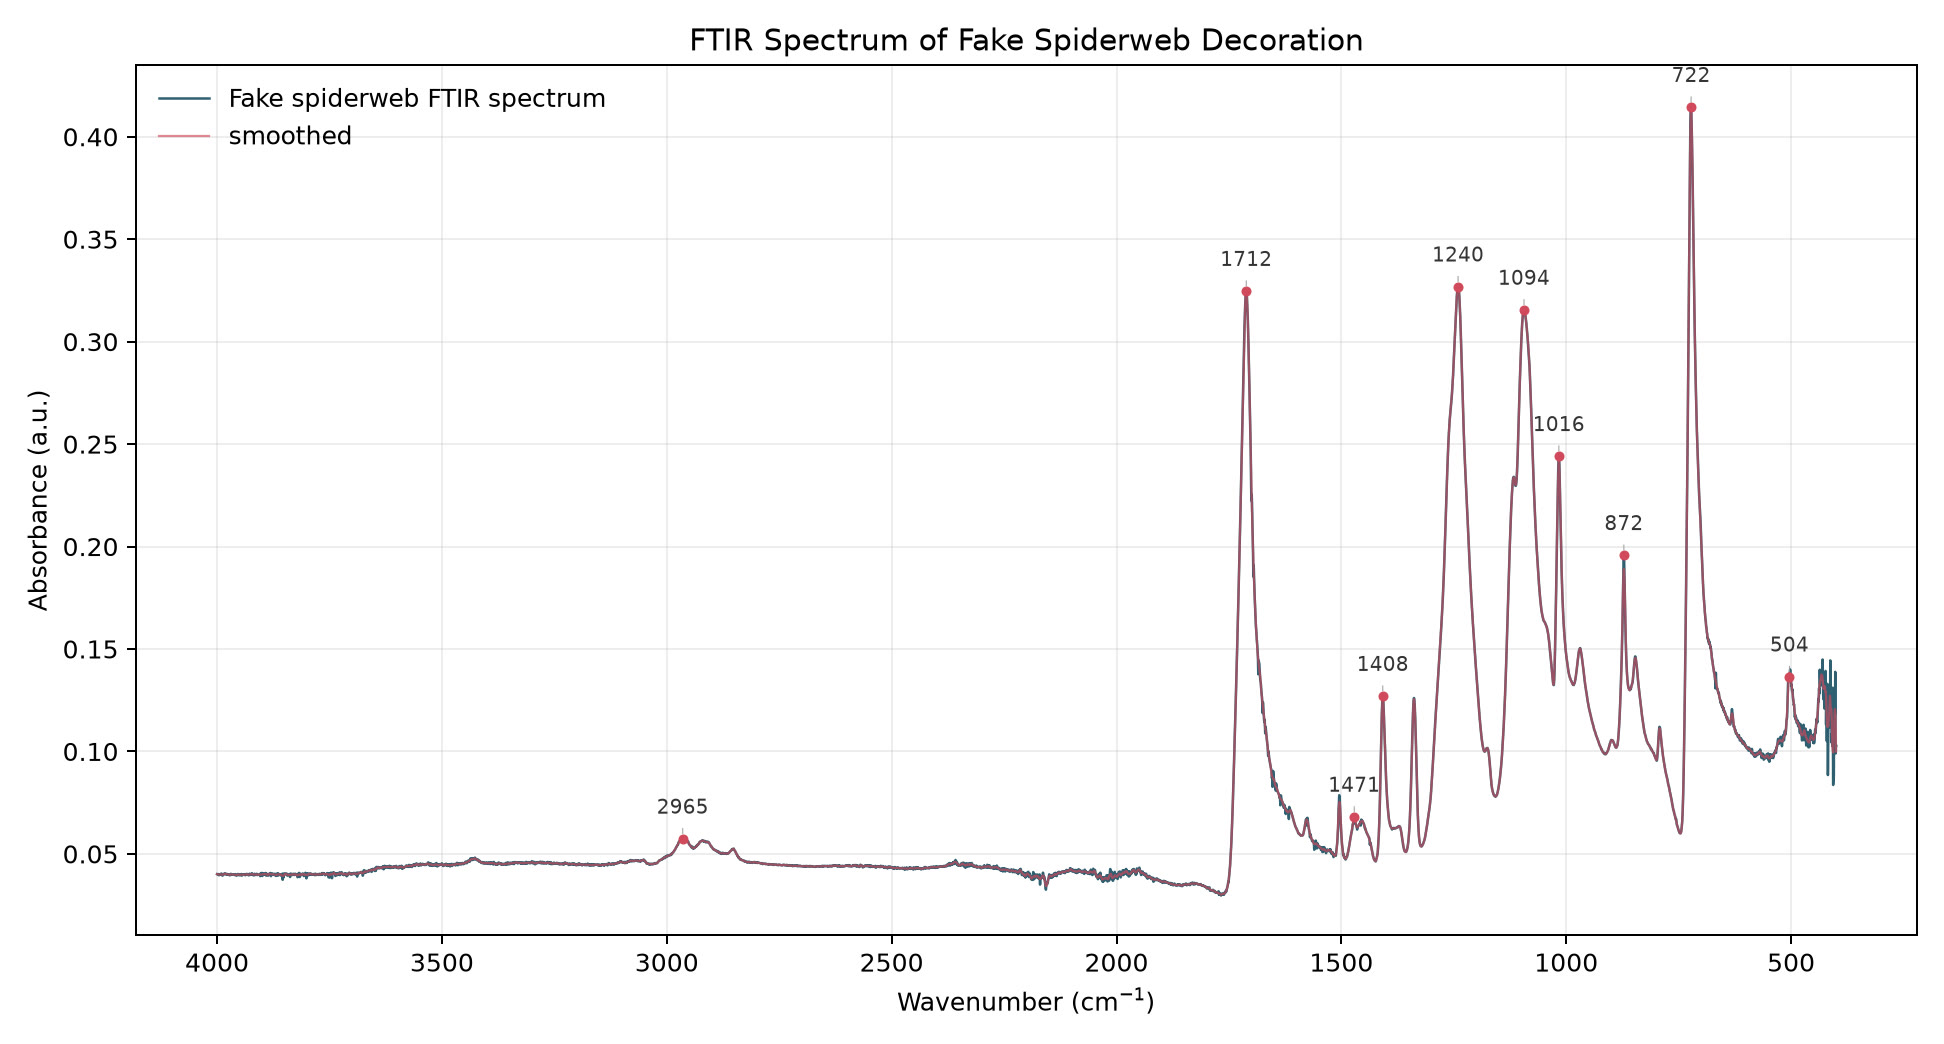
Start with the main peaks. Ask where strong absorptions appear, whether they are broad or sharp, and whether expected regions are present or missing. A broad feature can suggest O-H or N-H stretching; strong peaks near the carbonyl region can point toward molecules with C=O bonds; clusters of peaks in the fingerprint region can help distinguish similar materials.
Then compare, rather than relying on one peak alone. FTIR is most useful when you compare a sample spectrum with a known reference, a database hit, a control sample, or before/after spectra from the same project. A good match usually means several major features line up, not just one peak.
Think about how complicated the sample is before interpreting the spectrum. FTIR can be very useful for pure samples, suspected contamination on a mostly known material, or mixtures with a limited number of likely components. In those cases, you may be able to ask focused questions such as “does this look like polyethylene?”, “is this residue oily?”, or “did this surface pick up a silicone-like contaminant?” The answer is usually based on matching a pattern of peaks to a reasonable comparison, not on reading a chemical name from the spectrum.
For chemically complex bulk mixtures, the interpretation changes. Coffee is a good example: brewed coffee, roasted beans, or coffee residues contain many different reactive compounds mixed in unknown ratios. The FTIR spectrum of the bulk material is a combined molecular fingerprint from everything the infrared beam samples. That fingerprint can still be useful for comparison, such as comparing green and roasted coffee, different extraction methods, or before/after treatment, but it usually cannot be deconvoluted into a reliable list of individual compounds or concentrations.
If a spectrum is weak or has unexpected features, check Troubleshooting before interpreting it.
Limits On Identification
- FTIR usually identifies molecular features or material classes, not a complete formulation by itself.
- It cannot turn a complex bulk mixture into a list of every chemical component. When many compounds contribute overlapping peaks, the combined spectrum may be useful for comparison but not for assigning each peak to one ingredient.
- It is much stronger for pure samples, known materials with possible contamination, or simple mixtures than for unknown mixtures with dozens, hundreds, or thousands of components in unknown ratios.
- It cannot reliably identify materials that do not absorb infrared light strongly.
- It is often less direct for metals, ceramics, salts, and inorganic materials than for polymers, organics, and molecular solids.
- A database match is evidence, not proof. Similar materials can have similar spectra, and mixtures can be difficult to interpret.
- ATR mostly samples the material in contact with the crystal. A coating, residue, or surface layer can dominate the spectrum even if the bulk material underneath is different.
Compare And Process Spectra
- Compare several major peaks with a reference spectrum, database result, control sample, or before-and-after measurement.
- Note the sampling method: ATR, transmission, or diffuse reflectance.
- Keep a record of background conditions, sample preparation, and cleaning.
Use the Data Exploration Tools for a browser-based introduction to viewing and processing FTIR spectra. The Wiley KnowItAll software and libraries available through MIT Libraries support database searching and spectral comparison. Useful processing steps include baseline correction and labeling major peaks.
Troubleshooting
Weak ATR Signal
The sample may not be in close contact with the crystal. Reposition it, increase pressure until the clutch slips, use a different pressure tip, or use preview mode while adjusting contact.
Negative Features In A Spectrum
The crystal may have been dirty during background collection. Wear gloves to unload the sample, clean and dry the crystal and plate, then remove gloves and collect a complete new background on the bare, unclamped crystal. Reload and recollect the sample. Ask staff if the features remain.
Instrument Will Not Connect
Check instrument power and whether System Status shows a green check. A USB connection or OMNIC communication issue may need staff help; ask before changing cables or USB ports.
Spectrum Changes Between Repeat Measurements
Sample contact, variation within the sample, evaporation, or contamination may have changed. Clean the crystal, recollect the background if needed, and repeat on a representative region of the sample.
Unexpected Water, Carbon Dioxide, Solvent, Or Residue Peaks
Atmospheric or cleaning contamination, a wet sample, or incomplete drying may add features. Let solvent evaporate when safe, clean again, or ask staff about background and sample handling.
Cannot Find A Collected Spectrum
The spectrum may not have been individually selected and saved. Save each spectrum you need before closing OMNIC.
Explore FTIR
Questions You Can Explore
- Does a plastic, coating, adhesive, fiber, or residue have the expected chemical signature?
- Does an unknown powder resemble a reference polymer, sugar, oil, or other material?
- What broad molecular differences appear in approved biological materials, gels, scaffolds, or treated surfaces?
- What binders, coatings, or additives might be present in paper, pigments, or textiles?
- After microscopy reveals a film or residue, what kind of molecular material might it be?
See an example spectrum and the limits on identification when planning a comparison.
How It Works
FTIR spectroscopy uses infrared light to probe molecular vibrations. Molecules are not still objects: their bonds stretch, bend, twist, and rock. When infrared light has the right energy to drive one of those motions, the sample absorbs some of that light. The FTIR records absorption across many infrared wavelengths and displays the result as a spectrum.
Different chemical bonds absorb infrared light in different regions. For example, O-H, N-H, C-H, C=O, and C-O bonds tend to produce recognizable features. The lower-wavenumber “fingerprint” region can be especially useful because many molecules have distinct combinations of peaks there.
The attenuated total reflectance (ATR) accessory makes the measurement easier by pressing the sample against a diamond crystal. Infrared light reflects inside the crystal, and a very shallow evanescent field interacts with the sample touching the crystal surface. Good contact matters: if the sample does not touch the ATR window well, the spectrum may be weak or misleading.
Practice Activities
- Level 1 - General training: Collect ATR spectra from two approved, non-hazardous solids chosen to give visibly different spectra. Save each spectrum, compare their overall patterns, and note which handling step affected signal strength most.
- Level 1 - Cleaning check: Collect a background on a clean crystal, collect a sample, clean the crystal, then collect a second background. Compare whether any negative features or residue-related peaks appear.
- Level 2 - Liquid-sample extension: With staff guidance, collect an ATR spectrum from an approved non-volatile liquid. Practice loading without the pressure tower, containing the droplet, and cleaning the crystal and surrounding plate completely afterward.
- Level 2 - Sample-contact comparison: Collect the same solid sample with weak contact and with proper pressure. Compare signal strength and peak quality.
- Level 2 - Unknown comparison: Collect an unknown non-hazardous polymer or residue and compare it with a known reference or database result. Report the evidence for and against the proposed identification.
- Level 3 - Accessory comparison: With staff guidance, compare ATR with transmission or diffuse reflectance for a sample where the method choice changes the spectrum.
Manufacturer Manuals
- iS5 spectrometer user guide
- iD7 ATR user guide
- OMNIC software getting started guide
- Complete set of manufacturer manuals